By Ben Birken, CFP®
The first step to drawing in new prospects or retaining existing clients? Show them what you can bring to the table.
Studies show that it’s significantly easier to sell consumers a real, tangible product or service, but that can be difficult for financial planners. Financial planning doesn’t usually come wrapped up in a neat little box, it’s a long-term investment – so how can you show that your services are worth the money?
One of the most effective ways is by expanding your value prop with more services, and then delivering results to your clients in a visually compelling way – they want to see the service you’re providing.
That’s where Holistiplan’s Range Calculator comes in.
What is a Range Calculator?
The basic statistical goal of calculating range is to find the difference between your smallest and largest values.
A range calculator (or “range calc,” for short) serves essentially the same function in tax planning. The goal is to show you how various levels of additional income could affect your client’s taxes, whether you’re adding $1,000 or $250,000.
With Holistiplan’s automatic calculator tool, you can easily view endless scenarios that would otherwise take an enormous amount of time to calculate via spreadsheets or by hand.
Why Does it Matter?
The ability to automatically generate hundreds of possible scenarios is priceless when it comes to financial planning and modeling. The range calc tool allows advisors to dig deeper, drawing a curve of marginal tax outcomes as your clients step up or down in income.
Whether you’re calculating how much of your client’s Social Security income is taxable or trying to locate ripe opportunities for Roth conversions, a range calc can make life easier for both advisors and investors.
How Holistiplan’s Range Calculator Works
Our range calc builds off of our latest “Solve for Max” feature, which helps you find the upper limit on your clients’ tax brackets. Once you’ve done that, generating a client’s custom range calc is as easy as the push of a button.
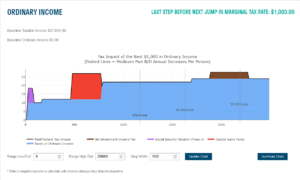
In Holistiplan, your screen will load with two charts: the “Ordinary Income” chart and the “Long-term Capital Gains” chart. The overall goal of these charts is to visually represent the “what-if” potential tax rates of adding more income in thousand dollar increments. The best part? Both charts are interactive, allowing you to zero in on breakpoints.


Both charts are color-coded to show the different types of taxes that could affect your client’s additional income. These include:
- Total federal tax impact
- Social Security taxation phase-in
- Taxes on ordinary income
- Net investment income tax
- Capital gains taxes
Also included is the ability to view various credits phasing in and out, such as the Child Tax Credit or Obamacare (ACA) credits.
You’ll also notice a tab on your screen. When clicked, this tab opens and shows several drop down options organized according to which chart they relate to. This section provides an informative description of each of the different types of taxes displayed on your charts.
It’s as easy as that – a range calc tool with easy-to-understand results you can share with your clients.
Welcome to the Future of Tax Planning
Tax planning doesn’t have to be complicated. With Holistiplan’s comprehensive tax planning software and Range Calc feature, you can generate those “what-if” deliverables in just moments – giving your clients a tangible product they can feel good about. Start your free trial of Holistiplan today.


